In this project, I would like to discover the physicians that are likely to commit fraud based on the 2013 U.S. Physician and Other Suppliers Dataset and Part D Prescriber Dataset. I am going to build a machine learning model that can detect the anomaly patterns in Medicare payments and be able to predict frauds in the future. These datasets are not labelled, so I need to search for the domain knowledge and background information in order to complete this project.
Congressman of Illinois at the time was Peter Roskam, who heavily considered the importance of detecting the Medicare fraud. On this link, the article mentions that the previous congressman said: “Worldwide credit card transactions, the credit card fraud rate is 0.04 percent, compared to almost 8 percent, 9 percent, 10 percent of Medicare Fraud.” These numbers are cited from two different governmental reports, which includes Government Accountability Office report and the U.S. Administration on Aging. Using these information, I am going to assume that the fraud rate percentage is between 8 to 10 percent.
Data Preprocessing:
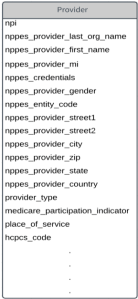
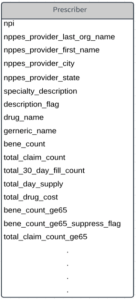
There are 27 columns for the provider table and 20 columns for prescriber table. Provider table is the services provided by the individual physicians and prescriber table is the drugs prescribed by the physician. First thing I want to do is to select the columns that are important and rename them to something more familiar. The next step for me is to create new features like payments, which is average_payment * service_provided. Then I want to aggregate the data based on npi (physician ID) as well as eliminating the physicians who did not participate in Medicare. Also, I did not include the physicians who are defined as an organization. I now want to do the same thing for the prescriber table.
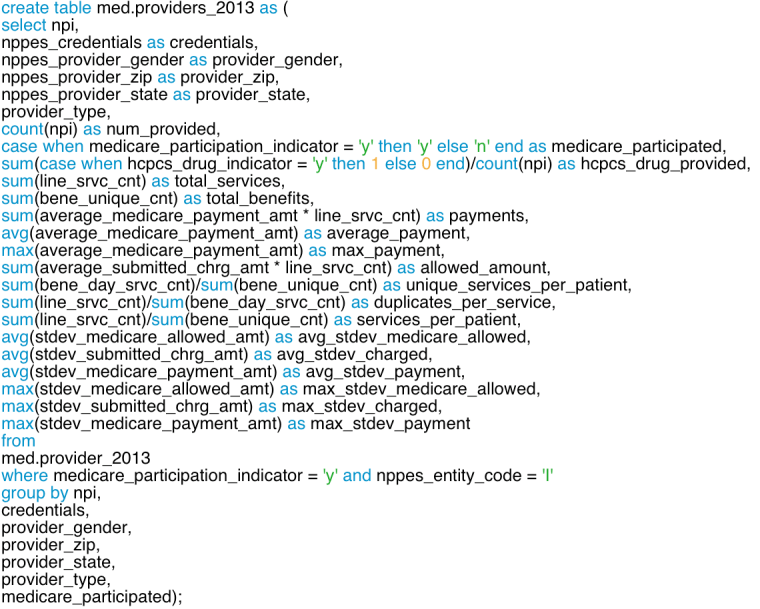
I will now join the two tables based on npi (physician ID). With all the aggregated data from both tables, I can now reduce the total columns of 47 columns to 24 columns. I have to make sure that the columns I use are relevant to the methods I am going to use to detect the fraud.
The four methods I will be using to detect the fraud are
- Rule-Based (SQL)
- K-Means
- Isolation Forest
- OneClass SVM
Rule-Based:
The first technique I am going to use is making a rule-based system, which is one of the oldest computer science technologies being used today. A lot of firms still use the rule-based system to solve problems and it is important to only include the rules that can clearly define the target you are solving for. Rather than defining the fraud with this method, I will use the analysis to compare to other algorithms I apply.
As mentioned above, I am going to predict that the Medicare fraud rate is 8 %. With this information, we can use window function to find out the physicians who have top 8% in each provider type. Window function will be further discussed in my next post.
K-Means:
K-Means Clustering is an unsupervised machine learning method, which can group k number of clusters in order based on its feature similarity. Before proceeding to K-Means, there are several steps I need to take. Since the size of the data is more than 500 thousand rows, we have to get a sample of the data to reduce the time it takes to run the model. I am going to use 10% of the data as it seems reasonable and I can still maintain enough data to run the model. I will then scale the data and apply PCA to reduce the dimensionality as I have more than 20 features and the variance is comparably high.

The next step is to find the k number in order to determine how many clusters I want to make. The method I am going to use to define it is the elbow curve. The elbow curve generally shows the relationship between the number of clusters and the distortion. As you can see from the graph below, we can see the efficiency of creating another cluster decreases when the k value is 4.
Now that we have the k value, we can proceed to make the K-Means with the k value of 4. If we plot out the K-Means, it does not look as clear as average K-Means clusters we are more familiar with. This is due to the feature scaling and PCA we have applied before making the clusters.

Now that I have the clusters, how should I detect the outliers? The way I am going to do this is setting the variables that are far away from the centroids within each cluster as outliers. In order to do this, we need to find the centroid of each cluster, then get the distance of each variable from the centroid and set a threshold so that if the distance is farther than what we set it to be, we can outline those values as outliers. The threshold I have used is 8%, which means all the variables that are top 8% farthest from the centroid will be labeled as frauds. Analysis of this will be covered after the explanation of Isolation Forest and One Class SVM.
Other Techniques:
There are two other techniques I want to share which can also detect frauds, which are Isolation Forest and One Class SVM. Isolation Forest basically isolates observations by randomly selecting a feature and selects a split value between the maximum and minimum values of the selected feature. One Class SVM learns a decision function for novelty detection, which classifies new data as similar or different to the training set. For both cases, I set the outlier fraction to 8% to be consistent.
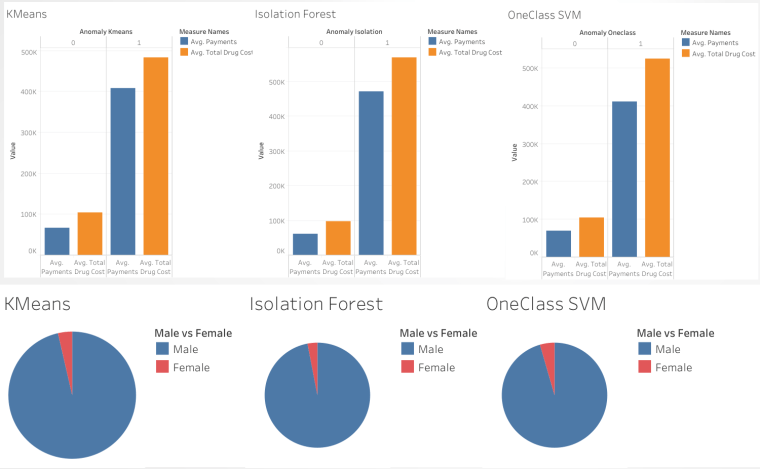
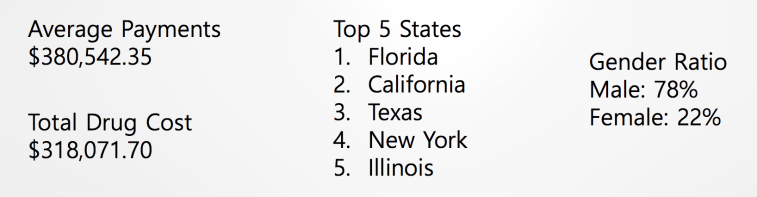
As you can see, all three of the algorithms have similar characteristics in terms of the payments, gender, and the drug costs. The physicians who committed frauds have higher average payments and average total drug costs compared to those who didn’t. Also, the gender ratio seems to be biased towards male, which can also relate to the rule-based system with higher percentage ratio for male. It is interesting to see how they provide similar characteristics despite using different algorithms. We should also consider the location as it is extremely important if we want to detect where they come from.

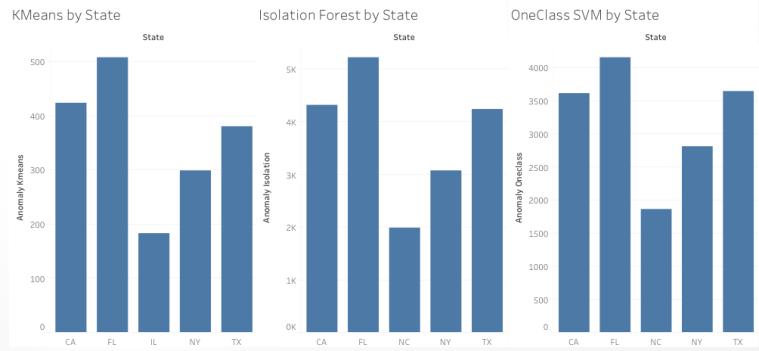
After analyzing where the frauds were committed, I was able to find which states cause them the most. With the combination of all 4 methods including rule-based, K-Means, Isolation Forest and One Class SVM, top 3 states that has most fraud counts are California, Florida, and Texas. One thing to mention, the count of K-Means clustering is about 10 times smaller because I sampled the data to 10% as mentioned previously.
Conclusion:
One thing I can conclude is that it was interesting to find out different ways of detecting fraud despite having labels on them. Of course, it is not dependable and accurate compared to the labeled data, but it can still provide some key insights and have some impacts on future prevention. Thank you for taking your time to read this blog!

Leave a comment